Design the scene
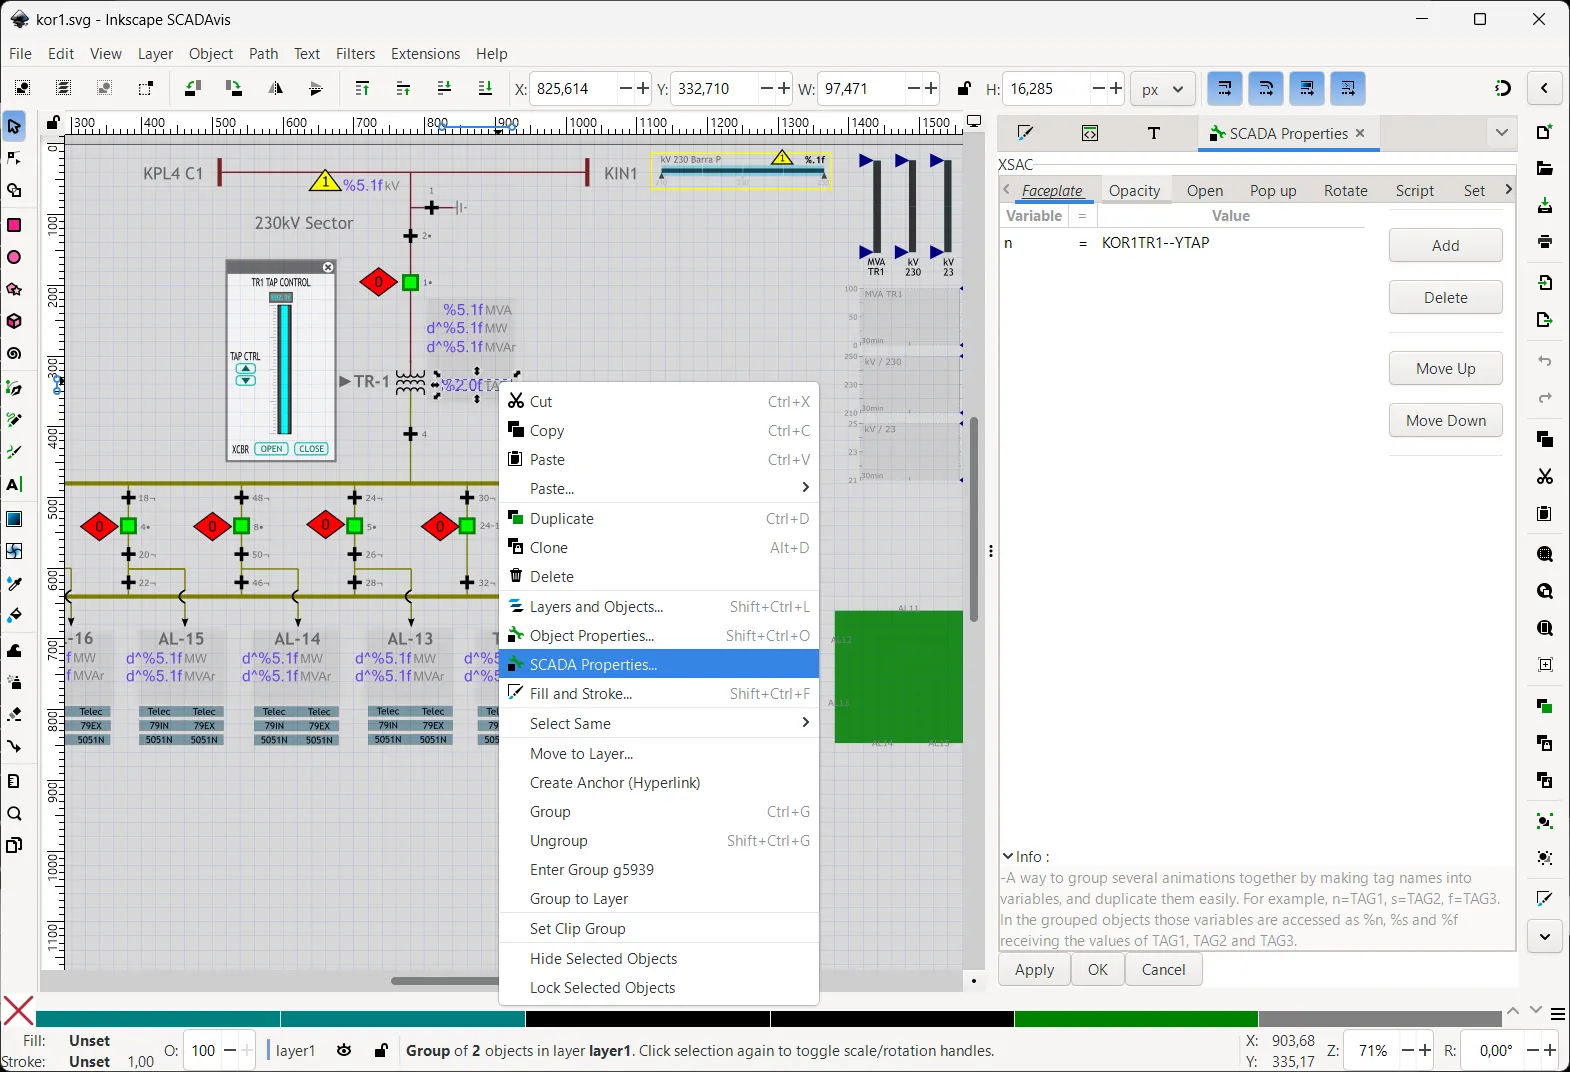
Create or refine vector graphics in the editor, then bind states, values, motion, and text to meaningful tags.
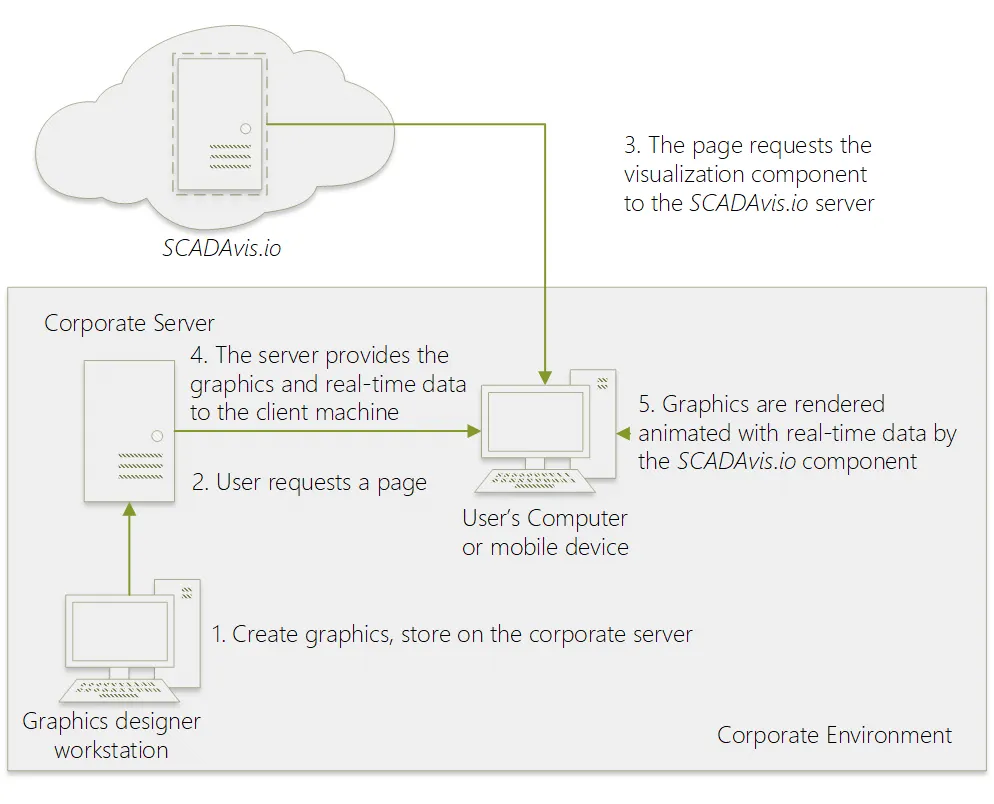
SCADAvis.io turns vector graphics into a polished operational surface for control rooms, dashboards, and embedded industrial web apps — driven by your real-time data.
A simple demo animating a bar graph and projected dashboard.
const script = document.createElement('script')
script.src = '/synoptic3/scada-vis.js'
script.type = 'module'
script.async = true
script.onload = () => {
  // Initialize the demo once the API is loaded
  scadavisInit({
    container: 'syn-demo',
    styleParams: 'height="490" width="555"',
    svgurl:
      'https://raw.githubusercontent.com/dscsystems/displayfiles/master/office2.svg',
  }).then((sv) => {
   sv.zoomTo(0.65)
   setInterval(function () {
    sv.storeValue('TAG1', Math.random() * 100)
    sv.storeValue('TAG2', 100 + Math.random() * 80)
    sv.storeValue('TAG3', 120 + Math.random() * 60)
    sv.storeValue('TAG4', 150 + Math.random() * 60)
    sv.storeValue('TAG5', 110 + Math.random() * 30)
    sv.storeValue('TAG6', 200 + Math.random() * 99)
    sv.storeValue('TAG7', 130 + Math.random() * 40)
    sv.updateValues()
   }, 1000)
  })
}This richer demo shows why SCADAvis.io works well for utility and industrial contexts where density, motion, and interaction all need to coexist.
// Load SCADAvis.io synoptic API
const script = document.createElement("script");
script.src = "https://scadavis.io/synoptic3/scada-vis.js";
script.type = "module";
script.async = true;
script.onload = () => {
  // Initialize the demo once the API is loaded
  scadavisInit({
    container: "subst-demo",
    styleParams: 'height="390" width="100%"',
    svgurl: "https://raw.githubusercontent.com/dscsystems/displayfiles/master/kor1-v2.svg",
  }).then((sv) => {
    sv.zoomTo(0.38);
    sv.enableMouse(false, false);
    sv.enableTools(true, true);
    sv.storeValue(
      "KOR1TR1--YTAP",
      Math.round(8 + Math.random()),
      false,
      false
    );
    sv.storeValue("KOR1XSWI1", false);
    sv.storeValue("KOR1XSWI2", true);
    sv.storeValue("KOR1XSWI4", true);
    sv.storeValue("KOR1XSWI6", true);
    sv.storeValue("KOR1XSWI8", true);
    sv.storeValue("KOR1XSWI10", false);
    sv.storeValue("KOR1XSWI12", true);
    sv.storeValue("KOR1XSWI14", true);
    sv.storeValue("KOR1XSWI16", false);
    sv.storeValue("KOR1XSWI18", true);
    sv.storeValue("KOR1XSWI20", true);
    sv.storeValue("KOR1XSWI22", false);
    sv.storeValue("KOR1XSWI48", true);
    sv.storeValue("KOR1XSWI50", true);
    sv.storeValue("KOR1XSWI46", false);
    sv.storeValue("KOR1XSWI24", true);
    sv.storeValue("KOR1XSWI26", true);
    sv.storeValue("KOR1XSWI28", false);
    sv.storeValue("KOR1XSWI30", true);
    sv.storeValue("KOR1XSWI32", true);
    sv.storeValue("KOR1XSWI34", true);
    sv.storeValue("KOR1XSWI36", true);
    sv.storeValue("KOR1XSWI38", false);
    sv.storeValue("KOR1XSWI40", true);
    sv.storeValue("KOR1XSWI42", true);
    sv.storeValue("KOR1XSWI44", false);
    sv.storeValue("KOR1XCBR2", true);
    sv.storeValue("KOR1XCBR3", true);
    sv.storeValue("KOR1XCBR4", true);
    sv.storeValue("KOR1XCBR8", true);
    sv.storeValue("KOR1XCBR5", true);
    sv.storeValue("KOR1XCBR2401", false);
    sv.storeValue("KOR1XCBR6", true);
    sv.storeValue("KOR1AL11TC", true, false, false);
    sv.storeValue("KOR1AL11RREC", true, false, false);
    sv.storeValue("KOR1AL11PSTI", true, false, false);
    sv.storeValue("KOR1AL12TC", true, false, false);
    sv.storeValue("KOR1AL12RREC", true, false, false);
    sv.storeValue("KOR1AL12PSTI", true, false, false);
    sv.storeValue("KOR1AL13TC", true, false, false);
    sv.storeValue("KOR1AL13RREC", true, false, false);
    sv.storeValue("KOR1AL13PSTI", true, false, false);
    sv.storeValue("KOR1AL14RREC", true, false, false);
    sv.storeValue("KOR1AL14PSTI", true, false, false);
    sv.storeValue("KOR1AL15TC", true, false, false);
    sv.storeValue("KOR1AL15PSTI", true, false, false);
    sv.storeValue("KOR1AL16TC", true, false, false);
    sv.storeValue("KOR1AL16PSTI", true, false, false);
    sv.storeValue("KOR1AL17TC", true, false, false);
    sv.storeValue("KOR1AL17RREC", true, false, false);
    sv.storeValue("KOR1ALTFTC", true, false, false);
    sv.storeValue("KOR1ALTFRREC", true, false, false);
    sv.storeValue("KOR1ALTFPSTI", true, false, false);
    sv.storeValue("KOR1AL11MW", 0, false, false);
    sv.storeValue("KOR1AL12MW", 0, false, false);
    sv.storeValue("KOR1AL13MW", 0, false, false);
    sv.storeValue("KOR1AL14MW", 0, false, false);
    sv.storeValue("KOR1AL15MW", 0, false, false);
    sv.storeValue("KOR1AL16MW", 0, false, false);
    sv.storeValue("KOR1AL17MW", 0, false, false);

    function updateSubstation() {
      let xcbr1 = Math.random() > 0.2 ? true : false;
      sv.storeValue("KOR1TR1-2XCBR5201", xcbr1, false, !xcbr1);
      let kv230 = 220 + Math.random() * 20;
      let kv23 =
        (kv230 / 10.3) *
        xcbr1 *
        Math.sqrt(sv.getValue("KOR1TR1--YTAP") / 7);
      sv.storeValue("KOR1KV230", kv230, false, kv230 > 239 || kv230 < 221);
      sv.storeValue("KOR1KV23", kv23, false, kv23 > 23.9 || kv23 < 22.1);

      let xcbr7 = Math.random() > 0.15 ? true : false;
      sv.storeValue("KOR1XCBR7", xcbr7, false, !xcbr7);
      sv.storeValue(
        "KOR1AL14TC",
        Math.random() > 0.15 ? true : false,
        false,
        false
      );
      sv.storeValue(
        "KOR1AL15RREC",
        Math.random() > 0.15 ? true : false,
        false,
        false
      );
      sv.storeValue(
        "KOR1AL16RREC",
        true,
        Math.random() > 0.15 ? true : false,
        false
      );
      sv.storeValue(
        "KOR1AL17PSTI",
        true,
        false,
        Math.random() > 0.15 ? true : false
      );

      let MW = 0,
        tMW = 0;
      let MVAR = 0,
        tMVAR = 0;
      tMW += MW = (5 + Math.random() * 2) * xcbr1 * xcbr7;
      tMVAR += MVAR = (0.5 - Math.random() * 1) * xcbr1 * xcbr7;
      sv.storeValue("KOR1AL11MW", MW, false, false);
      sv.storeValue("KOR1AL11MVAR", MVAR, false, false);
      tMW += MW = (3 + Math.random() * 2) * xcbr1;
      tMVAR += MVAR = (0.5 - Math.random() * 1) * xcbr1;
      sv.storeValue("KOR1AL12MW", MW, false, false);
      sv.storeValue("KOR1AL12MVAR", MVAR, false, false);
      tMW += MW = (6 + Math.random() * 2) * xcbr1;
      tMVAR += MVAR = (0.5 - Math.random() * 1) * xcbr1;
      sv.storeValue("KOR1AL13MW", MW, false, false);
      sv.storeValue("KOR1AL13MVAR", MVAR, false, false);
      tMW += MW = (4 + Math.random() * 2) * xcbr1;
      tMVAR += MVAR = (0.5 - Math.random() * 1) * xcbr1;
      sv.storeValue("KOR1AL14MW", MW, false, false);
      sv.storeValue("KOR1AL14MVAR", MVAR, false, false);
      tMW += MW = (5 + Math.random() * 2) * xcbr1;
      tMVAR += MVAR = (0.5 - Math.random() * 1) * xcbr1;
      sv.storeValue("KOR1AL15MW", MW, false, false);
      sv.storeValue("KOR1AL15MVAR", MVAR, false, false);
      tMW += MW = (3 + Math.random() * 2) * xcbr1;
      tMVAR += MVAR = (0.5 - Math.random() * 1) * xcbr1;
      sv.storeValue("KOR1AL16MW", MW, false, false);
      sv.storeValue("KOR1AL16MVAR", MVAR, false, false);
      tMW += MW = (5 + Math.random() * 2) * xcbr1;
      tMVAR += MVAR = (0.5 - Math.random() * 1) * xcbr1;
      sv.storeValue("KOR1AL17MW", MW, false, false);
      sv.storeValue("KOR1AL17MVAR", MVAR, false, false);
      tMW += MW = (4 + Math.random() * 2) * xcbr1;
      tMVAR += MVAR = (0.5 - Math.random() * 1) * xcbr1;
      sv.storeValue("KOR1ALTFMW", 0, false, false);
      sv.storeValue("KOR1ALTFMVAR", 0, false, false);

      sv.storeValue("KOR1TR1MW", tMW, false, false);
      sv.storeValue("KOR1TR1MVAR", tMVAR, false, false);

      sv.updateValues();
    }
    setInterval(updateSubstation, 2333);
    updateSubstation();

    sv.on("click", function (event, tag) {
      var v = sv.getValue(tag);

      if (event.currentTarget.id === "TAPUP") {
        sv.setValue(tag, v + 1, false, false);
        return;
      } else if (event.currentTarget.id === "TAPDOWN") {
        sv.setValue(tag, v - 1, false, false);
        return;
      }

      if (event.currentTarget.id === "XCBROPEN") {
        sv.setValue(tag, false, false, false);
        return;
      } else if (event.currentTarget.id === "XCBRCLOSE") {
        sv.setValue(tag, true, false, false);
        return;
      }

      if (v === true) sv.setValue(tag, false, false, false);
      else if (v === false) sv.setValue(tag, true, false, false);
    });
  });
};
document.body.appendChild(script);
The process is intentionally simple: build the visual, embed the runtime, and connect it to the data stream you already have.
Create or refine vector graphics in the editor, then bind states, values, motion, and text to meaningful tags.
Drop the Synoptic API into your page (self-hosted optionally) and let the visualization live inside a contained browser surface.
Feed tagged live values from your own data source and let the SCADAvis web component respond in real time.
SCADAvis.io does not ask you to replace your operational platform. It gives those systems a better visual surface. Open source, free to use integrations.

Drop interactive SVG scenes into dashboards while keeping Grafana data sources, observability tooling, and layout workflows.

Build responsive HMI experiences inside flows for automation and IoT projects that need more than raw status text.

Connect websocket-enabled brokers to live browser scenes for device telemetry, command flows, and edge-first monitoring.
Based on Inkscape 1.4.3 and adapted for data-linked animation, the editor lets teams build displays with vector precision.
The toolkit is free to use. Paid support is there for teams that need long-term maintenance, response, and commercial assurance.
SCADAvis.io logically separates display design from runtime and data integration. These core pieces make that combination practical.
Animate standard SVG assets with live values, status states, transforms, and operator interactions.
Push changing process values into the browser smoothly, the web component handles the visual changes.
Run inside modern web stacks, dashboards, or custom internal tools without hassle.
Map existing brokers, APIs, Node-RED flows, or dashboard systems directly into your visualization surface.
Adopt the runtime openly, self-host when needed, and extend the stack for your environment.
Keep data private and control how your graphics, runtime, and hosting are deployed.
Use displays with Grafana, Node-RED, MQTT, and custom web apps.
Build displays with a specialized SVG editor instead of coding displays and animations manually.