SCADAvis.io Synoptic Editor
The SCADAvis.io Synoptic Editor is based on the powerful Inkscape open source software. The SCADA markup is based on the Inkscape+SAGE project, also open source. The SCADAvis.io Synoptic Editor is also licensed as open source software (GPL v3).
The process of creating synoptic graphics for SCADAvis.io is very simple:
Tag Naming - Tags can be strings or numbers. Non-numeric strings should always begin with a letter (a-z or A-Z). Tags beginning with a number like “21xyz” will be converted to numbers. Do not begin a tag with any symbol, symbols are reserved for special purposes. If necessary, prefix your tag names with letters to avoid problems.
To learn how to use the Inkscape SVG graphics editor there is plenty of material available throughout the web. We just point some useful resources here.
Inkscape official manual:
http://tavmjong.free.fr/INKSCAPE/MANUAL/html/
Inkscape tutorials, books, videos, etc.:
https://inkscape.org/en/learn/
An interactive tutorial is available inside the editor in many languages (menu Help | Tutorials).
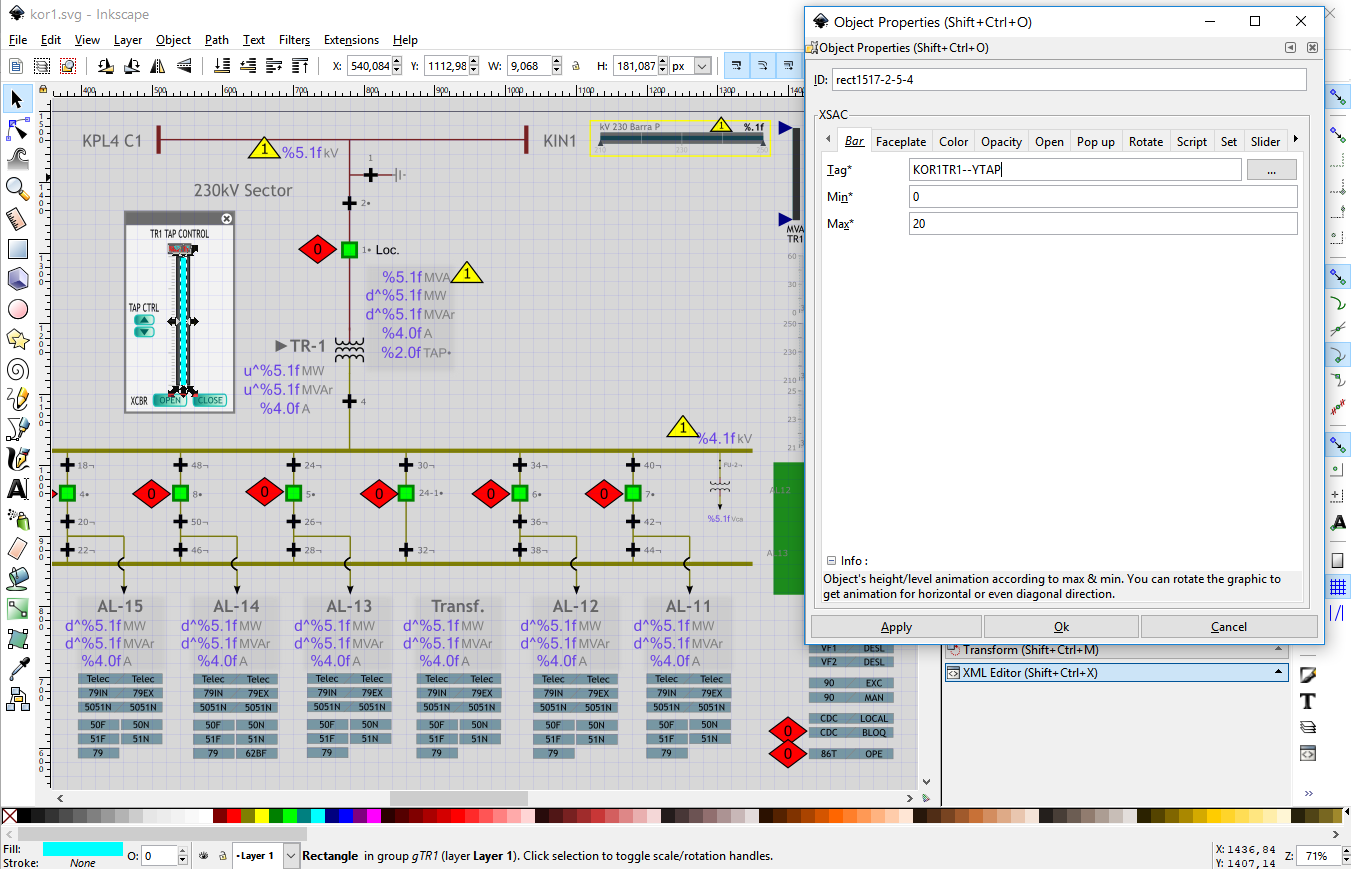
To edit SCADA animation properties of an object, right-click the mouse and choose Object Properties (please notice that albeit the Inkscape software interface is localized in many languages, the Object Properties menu is only available in English).
Follow below a list of attributes that can be utilized to animate graphics.
Get Color Bar Opacity Rotate Tooltips Slider Zoom
Script Text Faceplate Popup Set Open Special Codes
Editor interface showing the “Object Properties” dialog.
Purpose: retrieve and show values for tags.
Available for: SVG text objects only.
In the Tag field, put the tag to be retrieved its value. The fields Alignment and Type are ignored. To align text use the Inkscape “Text and Font” menu.
There are 3 ways to format values obtained by the “Get” directive.
when the text of the object contains the “|” (pipe) character, it is used convention C. When the text contains the “%” character, it is be used convention A. In all other cases it is used convention B.
It's possible to represent flow direction for analog values with an arrow in place of the value signal using the following codes (positioned where you want the arrow to be shown):
'u^': up pointing arrow for positive values (down for negative values);
'd^': down pointing arrow for positive values (up for negative values);
'r^': right pointing arrow for positive values (left for negative values);
'l^': left pointing arrow for positive values (right for negative values);
'a^': shows only the absolute value.
Examples of formatting, considering the value = -23.456:
format | presented text |
%6.2f | -23.47 |
%08.3f | -023.456 |
%1.0f | -23 |
%5.2fu^ | 23.47↓ |
l^%.1f | →23.1 |
Considering the value = 123456789.123:
format | presented text |
s | 123.456789123M |
.3s | 123M |
Purpose: change the fill/stroke color of objects according to limits for the value of points, change attributes, trigger SMIL animations and run small scripts.
Available for: all SVG object types, except groups.
Each line in the list of limits contains the following fields:
The last true condition will be considered and the other ignored.
The field “Limit” can have also some special values:
For digital points the following values for conditions apply:
The colors are the SVG colors (named or #RRGGBB value). “none” is the transparent color.
A single color value will be used as fill and stroke colors. To specify different fill and stroke separate 2 color values by a “|” (pipe) character. Example: “red|green” = red for fill and green for stroke.
A void fill color like in “|yellow” affects only the stroke while keeping the fill unaltered.
A void stroke color like in “black|” affects only the fill while keeping the stroke unaltered (recommended for text objects).
To interpolate colors between 2 values, use @color in the color field (fill or stroke) in the final line. Example:
To make fill colors that varies continuously between white and red proportionally to values between 0 and 10 for the tag TAG1.
Tag Value Color
TAG1 0 white|
TAG1 10 @red|
In the field “Color Name/Code” it's possible to change a SVG attribute instead of the color with the “attrib:” prefix. There must be a space after “attrib:”. Examples:
attrib: opacity=0.5
attrib: style=fill:red;text-decoration:underline;
In the field “Color Name/Code” it's also possible to run a Javascript short script with the “script:” option. There must be a space after “script:”.
The function $W.Animate can be used to animate objects with SMIL (SMIL is not implement in IE/Edge browsers). The first parameter is the object to be animated (“thisobj” represents the current object); the second is the animation type ('animate', 'set', 'animateTransform', 'animateColor' or 'animateMotion'); the third is the animation options. Examples:
script: $W.Animate( thisobj, 'animate', {'attributeName': 'x', 'from': 0, 'to': 10, 'fill': 'freeze', 'repeatCount': 5, 'dur': 5 } ); // animates on axis x, from 0 to 10 seconds, repeats 5 times.
script: $W.Animate( thisobj, 'animate', {'attributeName': 'width', 'from': 45, 'to': 55, 'repeatCount':5,'dur': 1 } ); // animates width between 45 and 55, 5 times in 1 second.
script: $W.Animate( thisobj, 'animate', {'attributeName': 'width', 'values': '45;55;45', 'repeatCount':5,'dur': 1 } ); // animates width for the values 45,55 and 45, 5 times in 1 second.
It's recommended to use $W.RemoveAnimate(thisobj) before creating a new animation to avoid cumulative animations.
Supports all SVG attributes, as in:
http://www.w3.org/TR/SVG/animate.html
For image objects: to load and change images dynamically use the “$W.LoadImage” function as this:
script: $W.LoadImage(thisobj, 'clipart/modem.png');
Power BI custom visual feature:
It is possible to use the Power BI Color Palette (theme).
Define colors as “-pbi-1” for the first color in the pallete, “-pbi-2” for the first and so on.
Other Power BI colors available are: -pbi-background, -pbi-foreground, -pbi-bad, -pbi-good, -pbi-maximum, -pbi-minimum, -pbi-selected, -pbi-positive, -pbi-negative.
These same shortcuts can be used in Vega specification files (see below).
Purpose: change the height of the rectangle.
Available for: rectangles.
In the “Tag” field, put the desired tag.
The fields “Min” and “Max” represents the expected range of values. The height of the object will be 100% of its size when the value of the point is equal to the Max value and 0% when equal to the value defined in the Min field.
Changes in different directions can be obtained by just rotating the object.
Purpose: change the opacity (opposite of transparency) of the object.
Available for: all types of SVG objects.
In the “Tag” field, put the desired tag.
The fields Min and Max represent the expected spread of point values. The opacity of the object will be 100% (totally solid) when the value of the point is equal to the Max value and 0% (totally transparent) when equal to the value defined in the Min field.
For digital points consider the value 0 for the ON (true) state and 1 for the OFF(false) state. For Min=0 and Max=1 the object will be solid for the OFF (false) state and disappear for the ON (true) state. With Min=1 and Max=0 the reverse effect will be obtained.
Purpose: rotate the object.
Available for: all types of SVG objects.
The “Tag” field must be the point number or tag.
Fill the fields “Max” and “Min” according to the value range of point. When the point reaches the value of Max the object will rotate 360 degrees. The object will not rotate when the point has the value of Min. The rotation is clockwise when Max > Min, to invert the rotation direction, let Min be greater than Max.
To adjust the center of rotation point of the object: click the object twice until shown the rotation guides, then press shift and drag the cross in the center of the object.
Purpose: show text when the mouse is over the object.
Available for: all types of SVG objects.
The fields Line 1 to Line 5 can be filled with the lines of text to be presented. “Size” and “Style” fields are ignored.
The tooltips can contain Javascript code between “!EVAL” and “!END” marks. Use “$V('TAG')” to obtain point values inside the Javascript expression. The expression will be evaluated and the resulting value of it will be shown. What is out of the “!EVAL” and “!END” marks will be presented as text. Clone object can receive the “$V(%n)” to obtain the point value of the cloned object (see the “Clone” attribute).
Example: Consider a tag TAG1 with a value of 22.1 and a point TAG2 with a value of 10.5.
Line 1: “AL11+AL12 = !EVAL $V('TAG1') + $V('TAG2') !END MW”, will present: “AL11+AL12 = 32.6 MW”.
Purpose: move the object in a straight.
Available for: all types of SVG objects.
The “Tag” field must be the desired tag. The fields “Max” and “Min” must be filled with the desired range of variation for the point. The object must be cloned (Edit | Clone | Create Clone or ALT+D). The original object defines the initial position (this position will be reached when the value is equal to Min). The clone object must be moved to the final position (the position to be reached when the value is equal to Max). Movement in the reverse direction can be obtained using switching the values of Min and Max.
Purpose: define a zoom region that is extended to the full viewer when clicked. Available for: all types of SVG objects, except text.
The object must be placed on the top of other objects and have an opacity >0 like “0.1”.
Feature unavailable for Power BI and Grafana plugins.
Purpose: associate Javascript code to an event.
Available for: all types of SVG objects.
Available events:
mouseup: release the mouse button.
mousedown: mouse click.
mouseover: mouse cursor entering the object.
mousemove: mouse cursor moving over the object.
mouseout: mouse cursor leaving the object.
exec_once: execute a script one time only after the screen is loaded and parsed.
exec_on_update: execute a script when data is updated
Vega specification markup options:
vega: old style Vega 1/2 specification. In the first line of the script must be written the tag list comma separated. In the next line either a URL to a specification or the specification itself beginning with a “{” char.
vega4: new style Vega 3/4/5 specification. In the first line of the script must be written the tag list comma separated. In the next line either a URL to a specification or the specification itself beginning with a “{” char.
vega-lite: vega-lite specification. In the first line of the script must be written the tag list comma separated. In the next line either a URL to a specification or the specification itself beginning with a “{” char.
vega-json: old style Vega 1/2 specification with no tags associated. In the first line of the script must be put a URL to a specification or the specification itself beginning with a “{” char. In the data section of the specification define “update_period“ in seconds for the periodic update of the data.
vega4-json: new style Vega 3/4/5 specification with no tags associated. In the first line of the script must be put a URL to a specification or the specification itself beginning with a “{” char. In the data section of the specification define “update_period“ in seconds for the periodic update of the data.
See Vega project site for tools and documentation of syntax: https://vega.github.io/vega/. In the Vega file (“data” / “values” section), use the following markup to refer to the tag list:
"PNT#1" to retrieve the current value of the first tag in the tag list;
"TAG#1" to retrieve the first tag in the tag list;
"LMI#1" reserved behavior;*
"LMS#1" reserved behavior;*
"FLG#1" to retrieve the qualifier flags of the first tag in the tag list;*
"FLR#1" to retrieve the failure of the first tag in the tag list;*
“SUB#1” reserved behavior;*
“BAY#1” reserved behavior;*
“DCR#1” reserved behavior;*
“HIS#1” to retrieve the historical curve of the first tag in the tag list;*
*Feature unavailable for the Power BI and Grafana plugins.
The function $W.Animate and thisobj can be used to animate objects in scripts:
$W.RemoveAnimate(thisobj); // remove previous animations
$W.Animate( thisobj, "animate", {"attributeName": "x", "from": 208 ,"to": 300, "repeatCount": 5, "dur": 5} ); // animate on axis x
$W.Animate( thisobj, "animate", {"attributeName": "y", "from": -301 ,"to":-400, "repeatCount": 5, "dur": 5} ); // animate on axis y
It's recommended to use $W.RemoveAnimate(thisobj) before creating a new animation to avoid cumulative animations.
Other useful function can toggle the visibility of an object and also apply a translation to it:
$W.ShowHideTranslate( 'id_of_object', x, y );
The function $W.makeDraggable(obj) can be used to make an object draggable.
Purpose: this attribute will display predefined texts associated with ranges of values.
Available for: text objects.
The “Tag” field must be filled with the desired tag.
The list of Tag Values' and associated Tag Texts' must be created with an ascending order of value. The value of the point will be tested against the list of Tag Value's to be greater than or equal to each of it. The last true condition will cause the associated text to be presented.
Use a Tag Value of “f” to test for invalid values and “a” for alarmed.
For digital points consider the values as shown previously in the Color attribute.
Purpose: this powerful concept permits to replicate groups of animated objects associating each replica to a different tag (or to a different set of tags).
Available for: groups of objects.
A model group of objects can be created associating the all the animations of an object(s) to an indirection like “%n” (use “%m”, “%p”, etc. to use more tag indirections in the same model). Next group all related objects that will compose the model. Then use the Faceplate attribute to resolve the indirections in the object with the list of Variables and Values. Variable is the indirection variable like “n” (here you must not put a “%”, just the character of the variable) and Value is the tag associated to it. So, all animations in the grouped objects will be related to the values of the resolved tag. Copy and paste the grouped object and change the tags of the variable(s) to obtain new objects with the same animations linked to other tags.
Purpose: control the action when the object is clicked.
Available for: all types of SVG objects.
The field Source can be:
Feature unavailable for the Power BI and Grafana plugins.
Purpose: configure the special functions.
Available for: all types of SVG objects.
Functions available:
#exec or #exec_once in the field “Tag” - executes once the script entered in the field “Source”.
#exec_on_update in the field “Tag” - executes the script entered in the field “Source” each time the screen is refreshed with new data.
#copy_xsac_from in the field “Tag” - copies the XSAC attributes from another model object(s) to the current object. Use the field “Source” to indicate the ID of the model object. Multiple ID's of model objects can be entered in the field “Source” separating them with commas. The other fields are ignored. This can be used to create models of actions that control the behavior of many other derived objects changing just the model object. This can be combined with the Faceplate attribute to replicate modeled objects.
#set_filter in the field “Tag” – reserved behavior.
#arc in the field Tag – draws a doughnut chart. The tag must be in the “Source” field. In the “Prompt” field there must be set three parameters separated by commas: the minimum value (normally zero), the maximum value (for a 360-degree arc) and the inner circle radius.
#radar in the field “Tag” – (for a rectangle object) defines a radar (spider web) graphic. List the points in the “Source” field separated by commas. The field “Prompt” can be used to change the configuration of the chart, by applying conventions from https://github.com/alangrafu/radar-chart-d3. Write the attribute names using double quotes. Ex:
{ “levels”:5, “maxValue”:200, “axisText”: false }
#vega4, #vega4-json or #vega-lite in the field “Tag” - defines a Vega (version 3/4/5) or VegaLite chart. List the tags in the “Source” field separated by commas. You can set the number of minutes to retrieve for historical data putting the pipe character and a number after the point list in the “Source” field (ex.: “38038|15”). The field Prompt must contain the Vega chart specification (JSON code that must begin with a ‘”{” ) or a URL link to a file (ex.: “http://site.com/charts/stacked.json”).
See Vega project site for tools and documentation of syntax: https://vega.github.io/vega/. In the Vega file (“data” / “values” section), use the following markup to refer to the tag list (from the “Source” field):
"PNT#1" to retrieve the current value of the first tag in the tag list;
"TAG#1" to retrieve the first tag in the tag list;
"LMI#1" reserved behavior;*
"LMS#1" reserved behavior;*
"FLG#1" to retrieve the qualifier flags of the first tag in the tag list;*
"FLR#1" to retrieve the failure of the first tag in the tag list;*
“SUB#1” reserved behavior;*
“BAY#1” reserved behavior;*
“DCR#1” reserved behavior;*
“HIS#1” to retrieve the historical curve of the first tag in the tag list;*
*Feature unavailable for the Power BI and Grafana plugins.
Purpose: plot graphic, open new pages, preview pages.
Available for: all types of SVG objects.
For “Source Type” = URL:
For rectangle objects and “Source Type” = “Tag”: draw a line with trend graphic plot inside the rectangle with the rectangle stroke width and color. Parameters:
Feature unavailable for Power BI and Grafana plugins.
Obs.: Special codes to obtain other point attributes instead of the point value in the XSAC animations, xyz represents the tag:
*Feature unavailable for the Power BI and Grafana plugins.
SCADAvis.io Power BI Custom Visual Tagging :
The Scadavis.io Power BI custom visual automatically creates Tags for the linked Power BI data. So, the SVG file must be created with graphics linked to the tags that will be encountered at runtime in the Power BI environment.
The are 2 methods of tagging available simultaneously.
Generic Method:
@1, @2, @3 and so on, represent the highest level of hierarchical grouping values.
@@1, @@2, @@3, etc. are the lowest level hierarchical grouping values.
@max - maximum value of the highest level grouping.
@min - minimum value of the highest level grouping.
@total - total value of the highest level grouping.
@@max - maximum value of the lowest level grouping.
@@min - minimum value of the lowest level grouping.
@@total - total value of the lowest level grouping.
@zero - a measure with value zero.
Specific Method:
Power BI specific measurement names from the Power BI data panel can be also used to tag objects. Be aware that when you employ specific names, the SVG file will only work when those specific measurements are selected into the Power BI data panel.