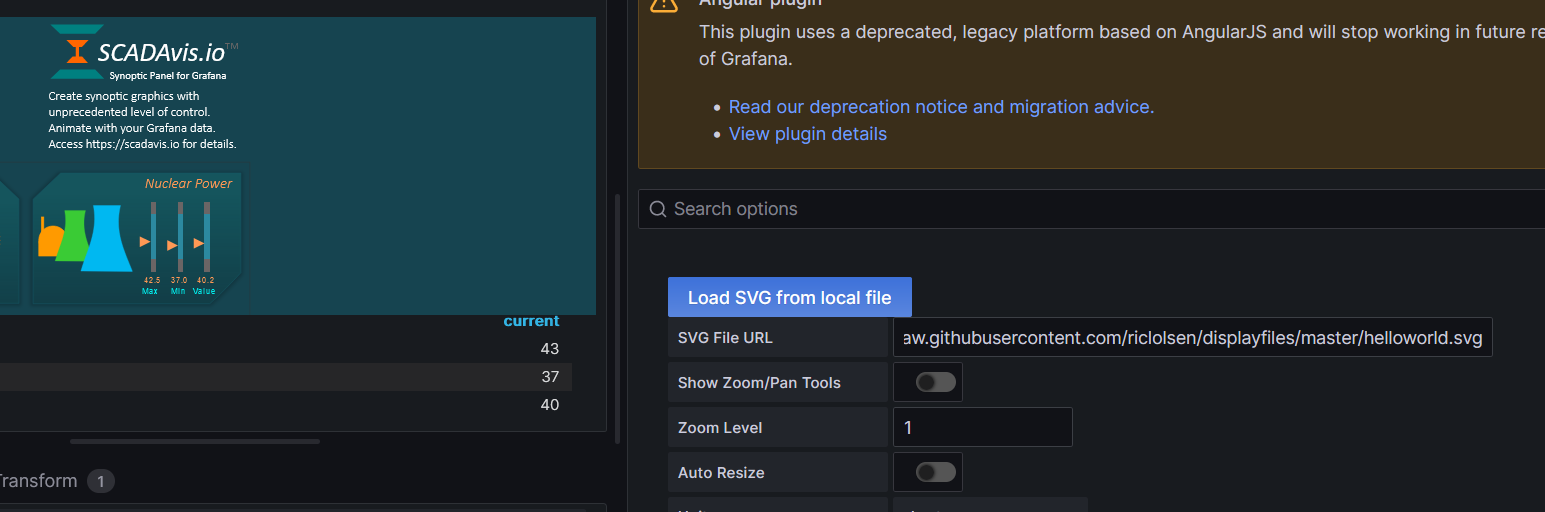
Usage Instructions for Older (Angular-based) Versions of the Plugin
Changes in the Grafana's plugin API requires a transformation operation to the data source for the SCADAvis Panel 1.x.x to work.
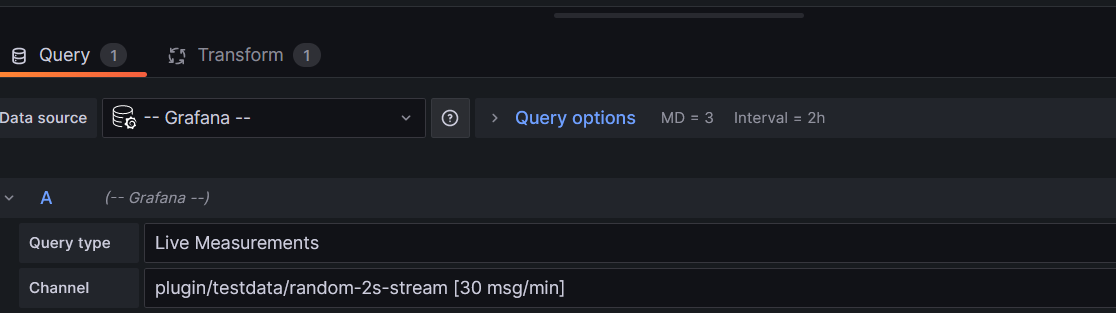
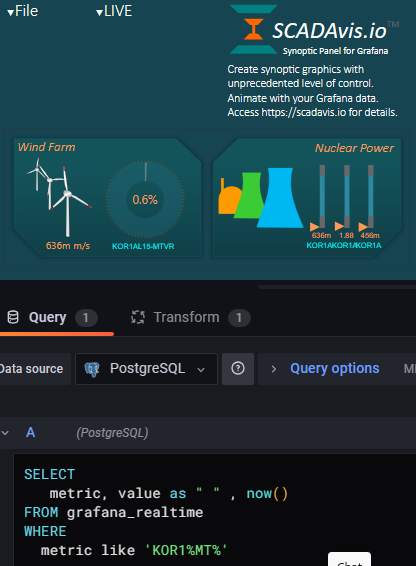
1. It is important that the data source can provide 'time', 'value' and 'metric' columns, where 'time' can be a dummy date or the current date/time.
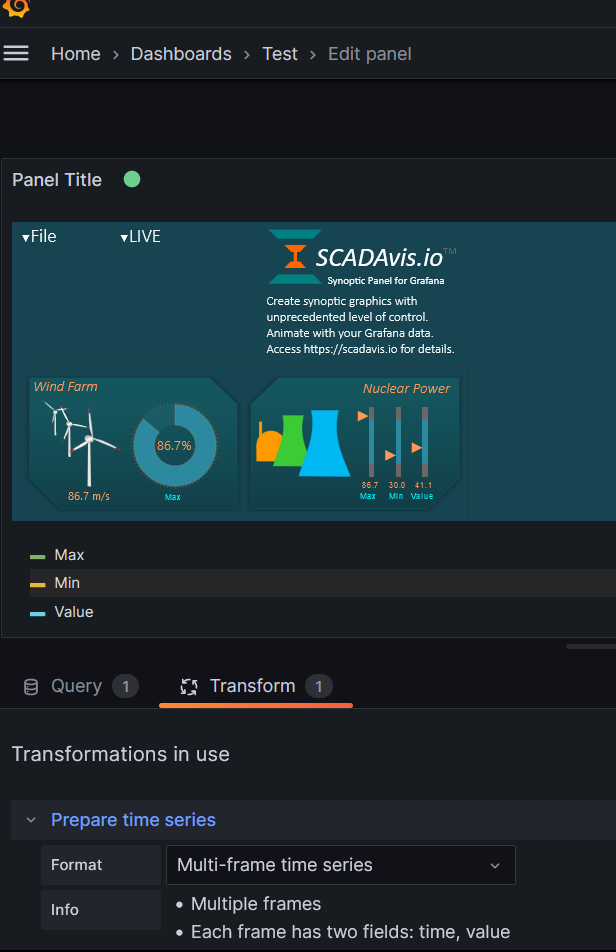
2. Apply the "Prepare Time Series" / "Multi-frame time series" transform operation to the data source.
1. It is important that the data source can provide 'time', 'value' and 'metric' columns, where 'time' can be a dummy date or the current date/time.
2. Apply the "Prepare Time Series" / "Multi-frame time series" transform operation to the data source.